

Every January, the same ritual plays out. Gym memberships spike. Diets start. And across LinkedIn, a wave of “Open to Work” banners appears almost overnight, as though the calendar itself had granted permission to start looking.
Search for a new job in January, the articles say. This is your month. This has been the common belief for years, and almost nobody is checking whether it's true.
We did. We pulled 25 years of government hiring data, matched it against five years of our own resume activity. Then we surveyed 500 U.S. recruiters and hiring managers directly to see if the people doing the hiring recognize the same pattern.
Job seekers show up hardest in January and February. Employers do the opposite. The most popular month for a job search sits right next to the weakest months for actual hiring.

Key takeaways
- Job postings peak three times a year, in April, July, and October, and hiring follows with a lag of about a month or two, staying strongest from May through August.
- June is the single best month to apply. Hiring runs 16.3% above average that month, the highest of any month, while job-seeker competition is 8% below average, one of the year's widest gaps in job seekers' favor.
- January and February are the worst combination of the year: the most people searching, against the least hiring happening.
- December is the slowest hiring month by far, but it's worth using to prepare, not to push. Almost nothing gets filled either way.
What do we mean by "the best time to job-search"?
Three different things could count as "best," and this piece answers all three.
- The most jobs get posted in certain months.
- The most people actually get hired in others.
- And in a third set of months, hiring is strongest relative to how many other people are competing for it, which is the closest thing to real odds a job seeker can use.
Those three questions don't always point to the same month. April, for example, shows up as a strong month for postings, but a mixed one once weighed against how many people are also searching. We're not hiding that.
Each section below builds on the one before it—first, when jobs are posted, then, when hires happen, and finally how those two combine into something closer to actual odds.
Why we're looking at the last five years
Two things shaped this window.
The first is our own data. As Enhancv grew, our U.S. resume records only get reliable starting in 2021. Earlier years are too thin to trust.
The second is math. Comparing our resume data against government data side by side means both need to cover the same years, and 2020's pandemic swings are extreme enough to distort even the years next to it. Cutting 2020 out and starting at 2021 gives us the longest clean run our resume data can support: 2021 through 2025.
So everything below, our numbers and the government data alike, covers 2021 through 2025 unless we say otherwise. A few outside sources (Google Trends, Indeed, Glassdoor) run on their own published windows, since we don't control when they collected their data. Where that's the case, we say so directly.
Let’s look into the data.
When do U.S. companies post jobs?
We started with the U.S. Bureau of Labor Statistics' Job Openings and Labor Turnover Survey (JOLTS). It's the only government series that counts open positions every month, going back to 2001.
Since the U.S. economy has grown and shrunk in ways that have nothing to do with the calendar, we removed that trend first.
We compared each month to a rolling 12-month average around it, which leaves only the seasonal pattern behind. A result of 100 means an average month. Above 100 means more postings than usual, below 100 means fewer.
We used 2021 through 2025 for the numbers below, the same five years as the rest of this piece.
U.S. job openings by month, 2021 - 2025, as reported by JOLTS
| Month | 2021 | 2022 | 2023 | 2024 | 2025 | Monthly openings index, U.S., % vs. average month |
|---|---|---|---|---|---|---|
| January | 7,124 | 11,281 | 10,442 | 8,561 | 7,612 | 102.7 |
| February | 7,418 | 11,209 | 9,500 | 8,143 | 7,008 | 97.0 |
| March | 8,355 | 12,029 | 9,510 | 8,066 | 6,807 | 96.6 |
| April | 9,939 | 12,607 | 10,672 | 8,119 | 7,667 | 109.7 |
| May | 9,721 | 11,206 | 9,126 | 7,584 | 7,104 | 99.0 |
| June | 10,071 | 10,907 | 8,899 | 7,195 | 6,982 | 97.4 |
| July | 11,954 | 12,616 | 9,401 | 7,999 | 7,586 | 107.2 |
| August | 11,077 | 10,157 | 9,267 | 7,536 | 6,952 | 100.0 |
| September | 10,969 | 10,827 | 9,235 | 6,913 | 7,136 | 101.4 |
| October | 11,967 | 11,089 | 9,047 | 7,754 | 7,540 | 105.3 |
| November | 10,515 | 10,030 | 8,164 | 7,254 | 6,591 | 94.9 |
| December | 10,694 | 10,182 | 7,947 | 6,798 | 6,088 | 93.9 |
Notice the raw counts fall every single year, since job openings across the whole economy shrank from 2022 through 2025. That's why the index column exists. It compares each month only to the surrounding months within that same year, so a five-year, economy-wide decline doesn't get mistaken for a seasonal pattern.
So according to public data, job openings spike three times a year: April, July, and October. We checked this against the full 25 years of data, not just the five highlighted here, and the pattern holds.
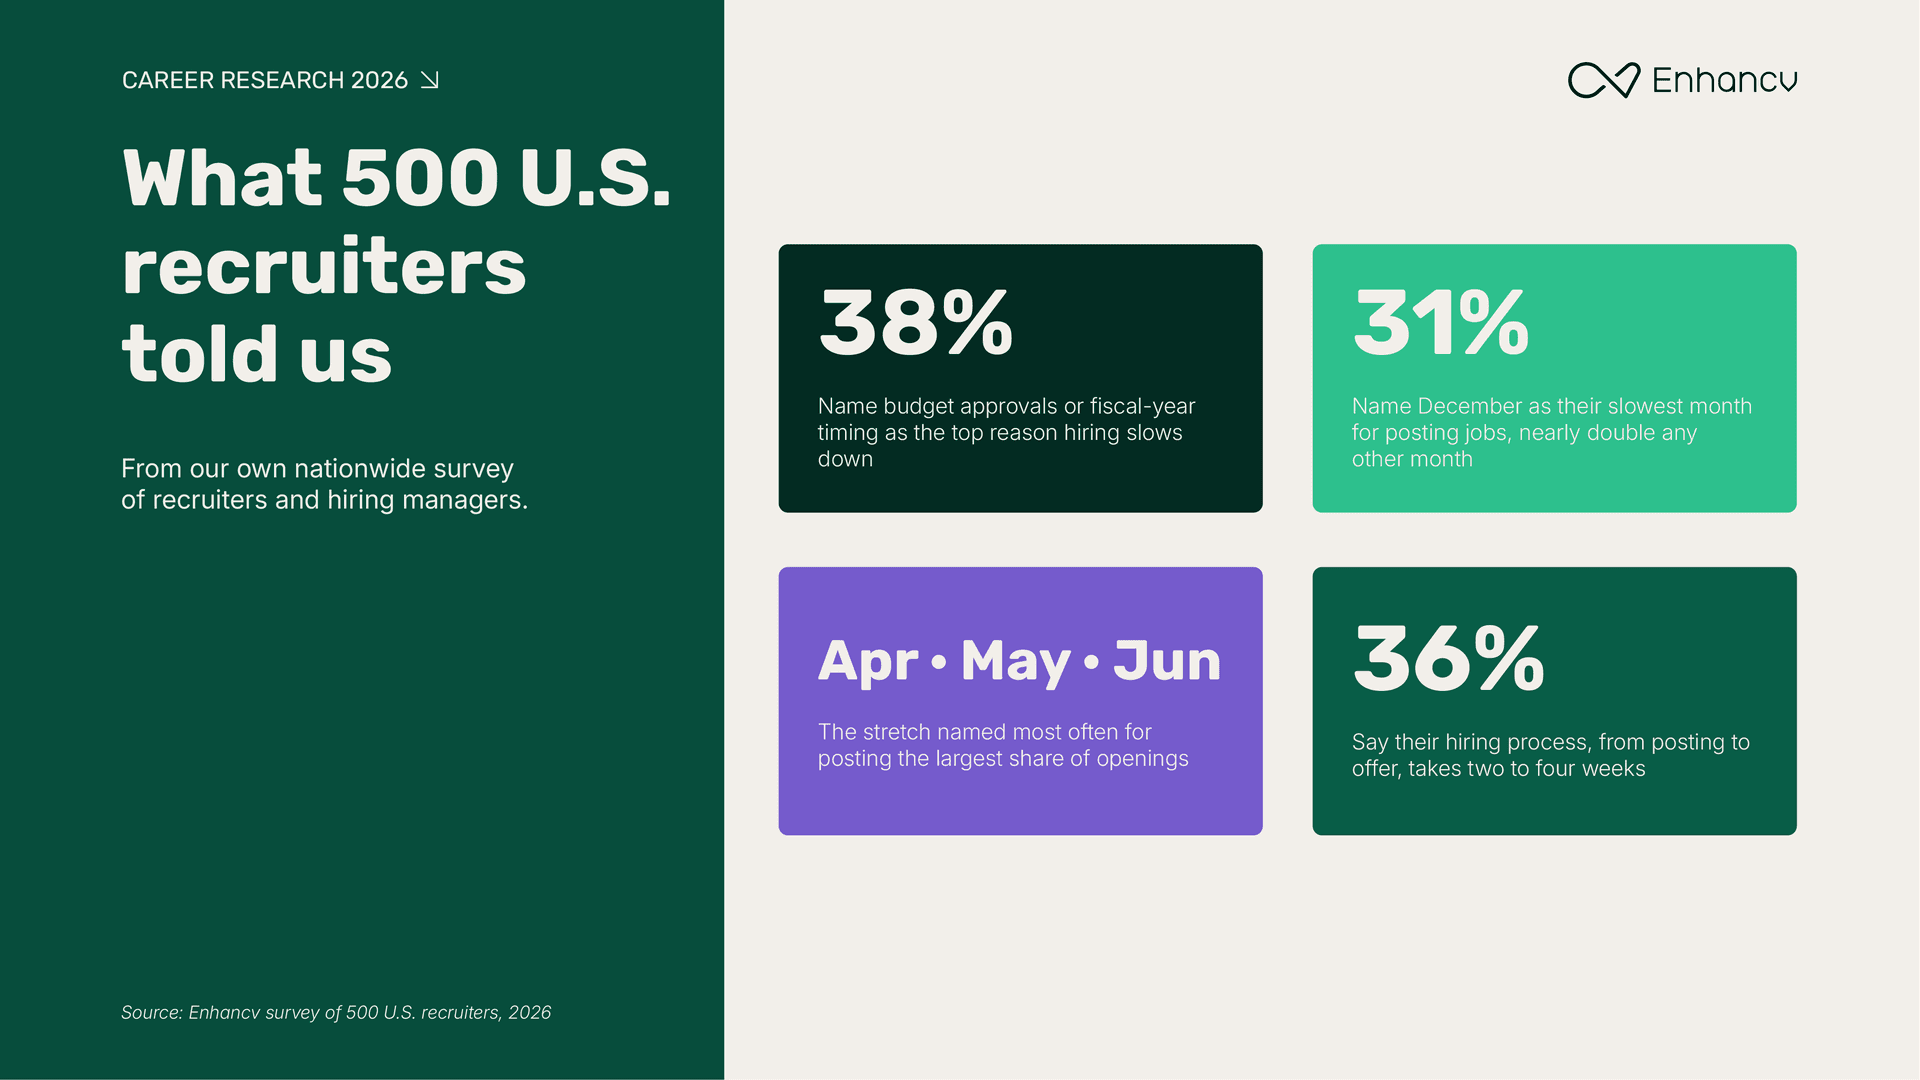
To hear from the people doing the hiring, we ran our own survey of 500 U.S. recruiters and hiring managers across healthcare, retail, tech, manufacturing, professional services, and several other industries.
500 people can't speak for the entire U.S. hiring market the way five years of monthly government data can, so we're treating their answers as corroboration, not proof on their own.

Months with the most openings according to surveyed recruiters
We asked which single month they post the most openings in. Among the 338 who report a single peak month rather than a steady pace, April, May, and June came out well ahead of every other month (12.7%, 13.6%, and 12.1%).
Recruiters see specific groups moving at specific times too, not just an undifferentiated wave.
- Seasonal and temporary workers show up before the holidays, according to 30.8% of the recruiters we surveyed.
- Recent graduates arrive in late spring and summer (38.6%).
- Career changers specifically stand out in January (22.2%), even though overall application volume doesn't spike that month.
However, posting a job and filling it are two different events. Posting it takes a day. Filling it takes weeks of interviews and, often, a slow-moving offer process.
That gap shows up in the numbers too. If postings spike in April, hires should catch up a month or two later, not right away. That's confirmed by 36% of surveyed recruiters, who say two to four weeks typically pass between posting a job and a candidate accepting an offer.
So when do hires really happen?
We ran the same math on JOLTS hires data, using the same 2021 to 2025 window as above. This shows how many people legitimately started a new job each month, not how many jobs were open.
U.S. hires by month, 2021 - 2025, as reported by JOLTS
| Month | 2021 | 2022 | 2023 | 2024 | 2025 | Monthly hires index, % vs. average month |
|---|---|---|---|---|---|---|
| January | 5,391 | 6,214 | 6,152 | 5,464 | 5,125 | -3.4% |
| February | 4,858 | 5,737 | 5,082 | 4,779 | 4,482 | -15.3% |
| March | 5,665 | 6,116 | 5,464 | 5,063 | 4,947 | -7.6% |
| April | 6,498 | 6,928 | 6,268 | 5,866 | 5,834 | +6.3% |
| May | 6,653 | 7,176 | 6,822 | 6,173 | 6,040 | +14.2% |
| June | 7,511 | 7,464 | 6,827 | 5,907 | 6,102 | +16.3% |
| July | 7,341 | 7,106 | 6,231 | 5,972 | 5,739 | +11.0% |
| August | 7,153 | 7,122 | 6,528 | 5,789 | 5,652 | +10.8% |
| September | 6,664 | 6,229 | 5,786 | 5,431 | 5,256 | +0.4% |
| October | 7,164 | 6,548 | 6,113 | 5,530 | 5,465 | +4.6% |
| November | 6,340 | 5,653 | 4,998 | 4,668 | 4,451 | -12.0% |
| December | 4,957 | 4,539 | 4,072 | 3,873 | 3,879 | -26.5% |
June comes out highest, 16.3% above average. December comes out lowest by a wide margin, 26.5% below.
Line the two charts up, and the story clicks into place. Postings jump in April, and hires follow in May and June once interviews have time to play out. Postings jump again in July, and hiring stays strong through August.
Openings and hires index plotted together, 2021 - 2025
| Month | Job openings index | Hires index |
|---|---|---|
| January | +2.7% | -3.4% |
| February | -3.0% | -15.3% |
| March | -3.4% | -7.6% |
| April | +9.7% | +6.3% |
| May | -1.0% | +14.2% |
| June | -2.6% | +16.3% |
| July | +7.2% | +11.0% |
| August | 0.0% | +10.8% |
| September | +1.4% | +0.4% |
| October | +5.3% | +4.6% |
| November | -5.1% | -12.0% |
| December | -6.1% | -26.5% |
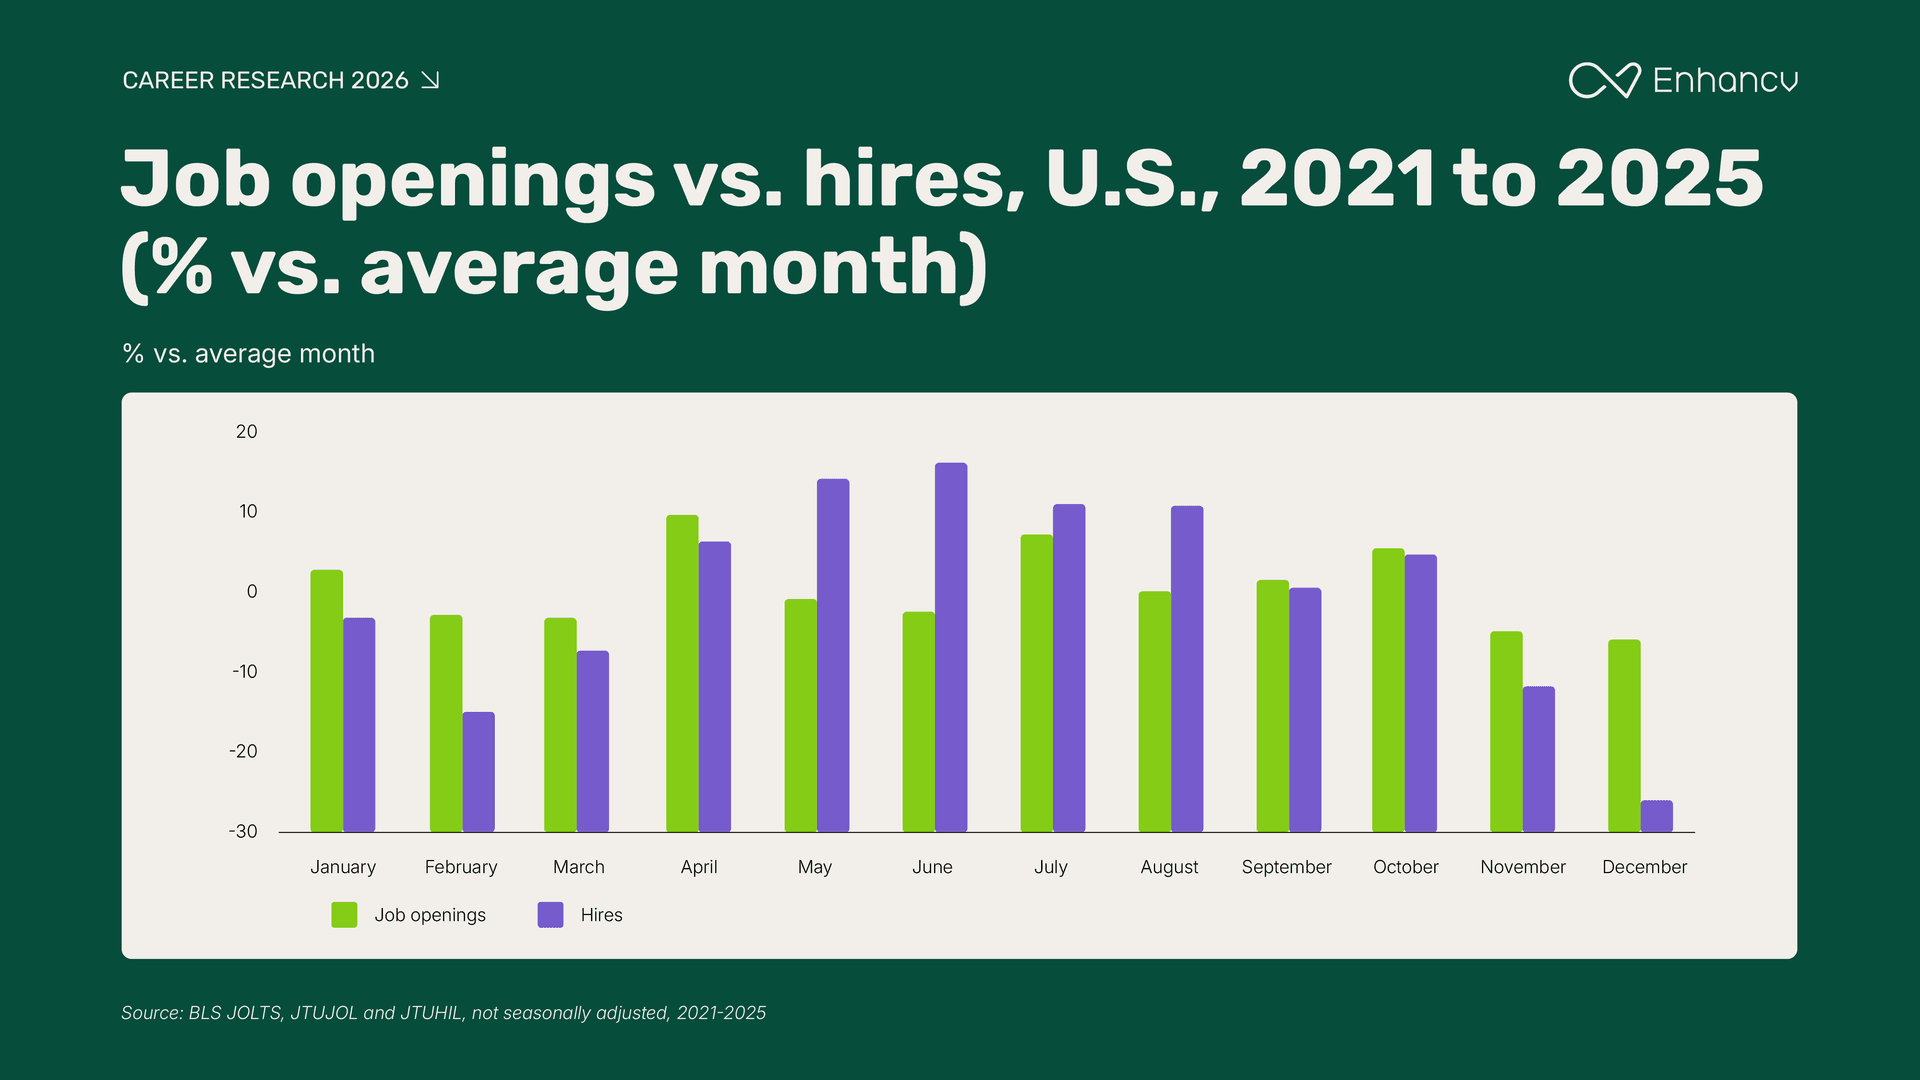
The lag is visible without needing the chart: openings peak in April, and hires peak the following month or two, in May and June. Openings peak again in July, and hiring stays elevated through August.
Recruiters we surveyed see the same clustering. Asked when they notice the biggest spike in candidate applications, the top two answers were April through June (27.2%) and July through September (25.6%), well ahead of the other two quarters. That's the same stretch where postings and hires both peak in this data. Applications cluster where the postings are.
Then everything cools off. By December, both postings and hires sit at their lowest point of the year, and February isn't far behind.
Then why do most people job search in January and February?
We wanted a real feel for why candidates behave the way they do, so we looked at our own data.
One boundary before the numbers: nothing here proves anything about hiring. We can see when people search, prepare, and pay for Enhancv's tools. We can't see who gets hired or when. The two sections above already covered the hiring side, using government data.
What follows describes when people act like they're job hunting, not when hiring actually happens.
With that said, if hiring is weak in January and February, why do job seekers pile in exactly then?
We pulled a U.S.-only cut of our own resume activity to check, matching the same 2021 to 2025 window as everywhere else in this piece. That's 1.8 million U.S. resumes, attributed to the job seeker's own listed location, and 662,214 of them were downloaded.
Here's what those five years show, next to the U.S. hiring numbers from the section above:
Resume downloads (Enhancv data only) vs. hiring (JOLTS), 2021 to 2025
| Month | Resume downloads | Hires |
|---|---|---|
| January | +11.6% | -3.4% |
| February | +13.9% | -15.3% |
| March | +3.8% | -7.6% |
| April | -0.9% | +6.3% |
| May | -9.1% | +14.2% |
| June | -8.0% | +16.3% |
| July | -1.6% | +11.0% |
| August | +1.3% | +10.8% |
| September | -2.3% | +0.4% |
| October | -17.2% | +4.6% |
| November | -18.1% | -12.0% |
| December | -26.0% | -26.5% |
The two calendars move in almost opposite directions. Line up all twelve months, and there's no meaningful relationship, in either direction, between how many people are searching in a given month and how much hiring is genuinely happening. Job seekers and employers look like they're running on two separate calendars, not opposite ends of the same one.
A separate cut splits U.S. downloads by how established the account already was, from same-day signups to accounts over a year old. This one isn't restricted to the same five-year window as the rest of this piece. The source data doesn't break it out by year, so treat it as a supporting pattern rather than a period-matched figure.
Enhancv resume downloads by account age, February vs. December
| Account age at download | February index | December index |
|---|---|---|
| Same day as signup | 123.0 | 79.5 |
| 1 to 30 days old | 162.7 | 67.6 |
| 1 to 12 months old | 125.6 | 68.3 |
| Over a year old | 120.6 | 70.0 |
January produces more candidates. I‘m not convinced it produces better ones. [...] Recruiters don’t need more applications. We need more qualified applications. Give me 10 people who really fit the position over 200 resumes I have to sort through to find them.
Mike Maffei, Founder & Executive Career Advisor at MikeMaffei.com
Every cohort peaks in February and bottoms out in December, including people who'd had an account with us for over a year, with no reason to be caught up in a new-signup rush. The February pattern isn't just new visitors discovering the tool at the start of the year. It shows up in people who were already established users.
Within our five-year window, February held up on its own terms too. It never ranked below third out of twelve months in any of the five years. It was the single busiest month once, in 2023, and finished in the top two three times.
Why the ‘apply in January’ story keeps circulating
I think this persists because it's a simple and memorable tip people can give, and it’s partly rooted in how corporate planning works. [...] The mistake, I would say, is treating this general trend like it's a rule.
Jon Hill, Chairman & CEO at The Energists
January’s usually measured against the wrong baseline.
Using our own numbers, January resume downloads run 11.6% above a typical month. Measured against December instead of the annual average, that same January looks like a 51% surge, more than four times bigger, from identical underlying data.
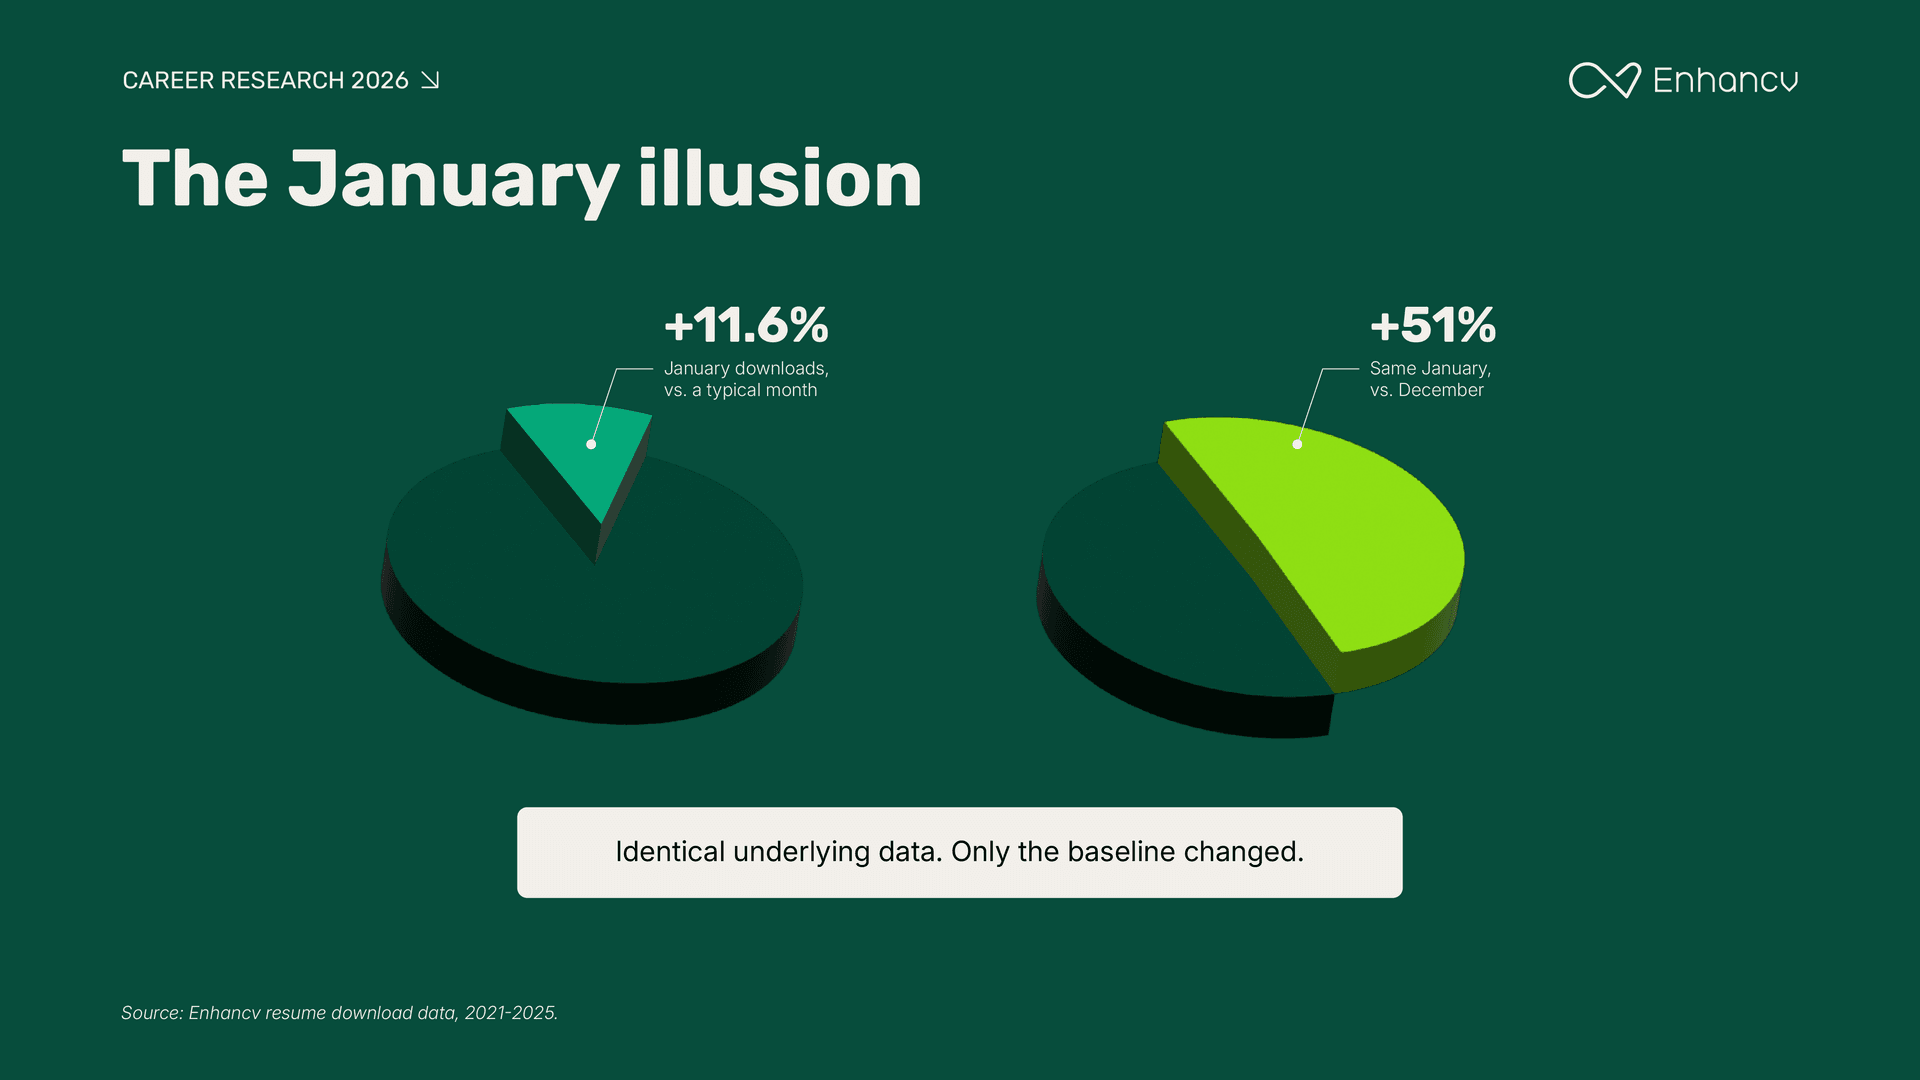
The same trick flips the sign entirely on the hiring side. U.S. hiring in January runs 3.4% below an average month, but measured against December, it looks like a 31% jump. A December baseline can turn one of the year's weaker hiring months into something that reads like a boom.
We're not the only ones seeing the seeker-side pattern. We pulled the actual Google Trends export for U.S. searches on"resume" and ran it through the same detrending method as everything else in this piece. January comes out 13.2% above average and February 9.7% above average, the two clear leaders. September is a closer third, at 7.2%, worth knowing since it's not far behind February.

A side note on outside corroboration
Both Indeed's Hiring Lab and Glassdoor have measured a January seeker-activity jump too. Glassdoor's most recent figure, published in January 2025, puts it at 11% above a typical month.
Neither matches our exact window or method, so we're treating both as background, not primary evidence.
Put together: our own five-year resume data, Indeed's overlapping years, Glassdoor's number, and Google Trends all point in the same direction. Job seekers ramp up sharply in January and February no matter who's doing the measuring.
One clarification worth making here, since it's a natural next question. The application-spike figures from recruiters, shown earlier in this piece, track almost exactly with when they post the most jobs, not with a separate rise in candidate activity.
In other words, recruiters see more applications when there's more to apply to, which is a different measurement than the resume-preparation behavior described above. The two aren't in tension: people can prepare early without submitting most of their applications until postings catch up.
December is the one month everyone agrees on, in every dataset in this piece. Job postings, hires, resume downloads, and new subscriptions all hit their low point in December.
The recruiters we surveyed agree too. Among the 338 who told us they have one slowest month rather than a steady, no-peak pace, December is named most often, by a wide margin—31.4%, nearly double the next closest answer.
If there's a genuinely weak month to search, this is it.
One exception
One industry breaks the pattern, and it makes obvious sense why.
Among the 54 surveyed retail and hospitality recruiters, 34 named a single slowest month and 20 said their hiring has no real peak or trough. Of those 34, only 14.7% name December as their slowest posting month, against 31.4% of recruiters overall.
Retail and hospitality recruiters report the highest seasonality of any industry in the survey: 75.9% call their hiring highly or somewhat seasonal (n=54), against roughly 57% across the full sample. It's a small subgroup, so treat the exact figure as directional rather than precise, but the direction matches retail's holiday hiring pattern.
Which months favor job seekers, and which favor employers?
Knowing the two calendars don't track each other raises an obvious follow-up: which months lean which way, and how reliably?
Take June as a concrete example, since it shows exactly how the two numbers combine. U.S. hiring runs 16.3% above average that month, an index of 116.3, where 100 is an average month. Enhancv's U.S. resume downloads run 8% below average, an index of 92.0. Divide one by the other: 116.3 ÷ 92.0 comes out to 1.26, or 26% in job seekers' favor.
More hiring is happening, and fewer people are actively competing for it.
We ran the same division for every month: the U.S. hiring index divided by the resume-download index, both already expressed against their own average month, where 100 equals average. A result above 100%, meaning above that month's average hiring-to-searching balance, means more hiring than that month's search activity would predict, an advantage for job seekers.
A result below 100% means the opposite: more people competing for the hiring that's ultimately happening, an advantage for employers.
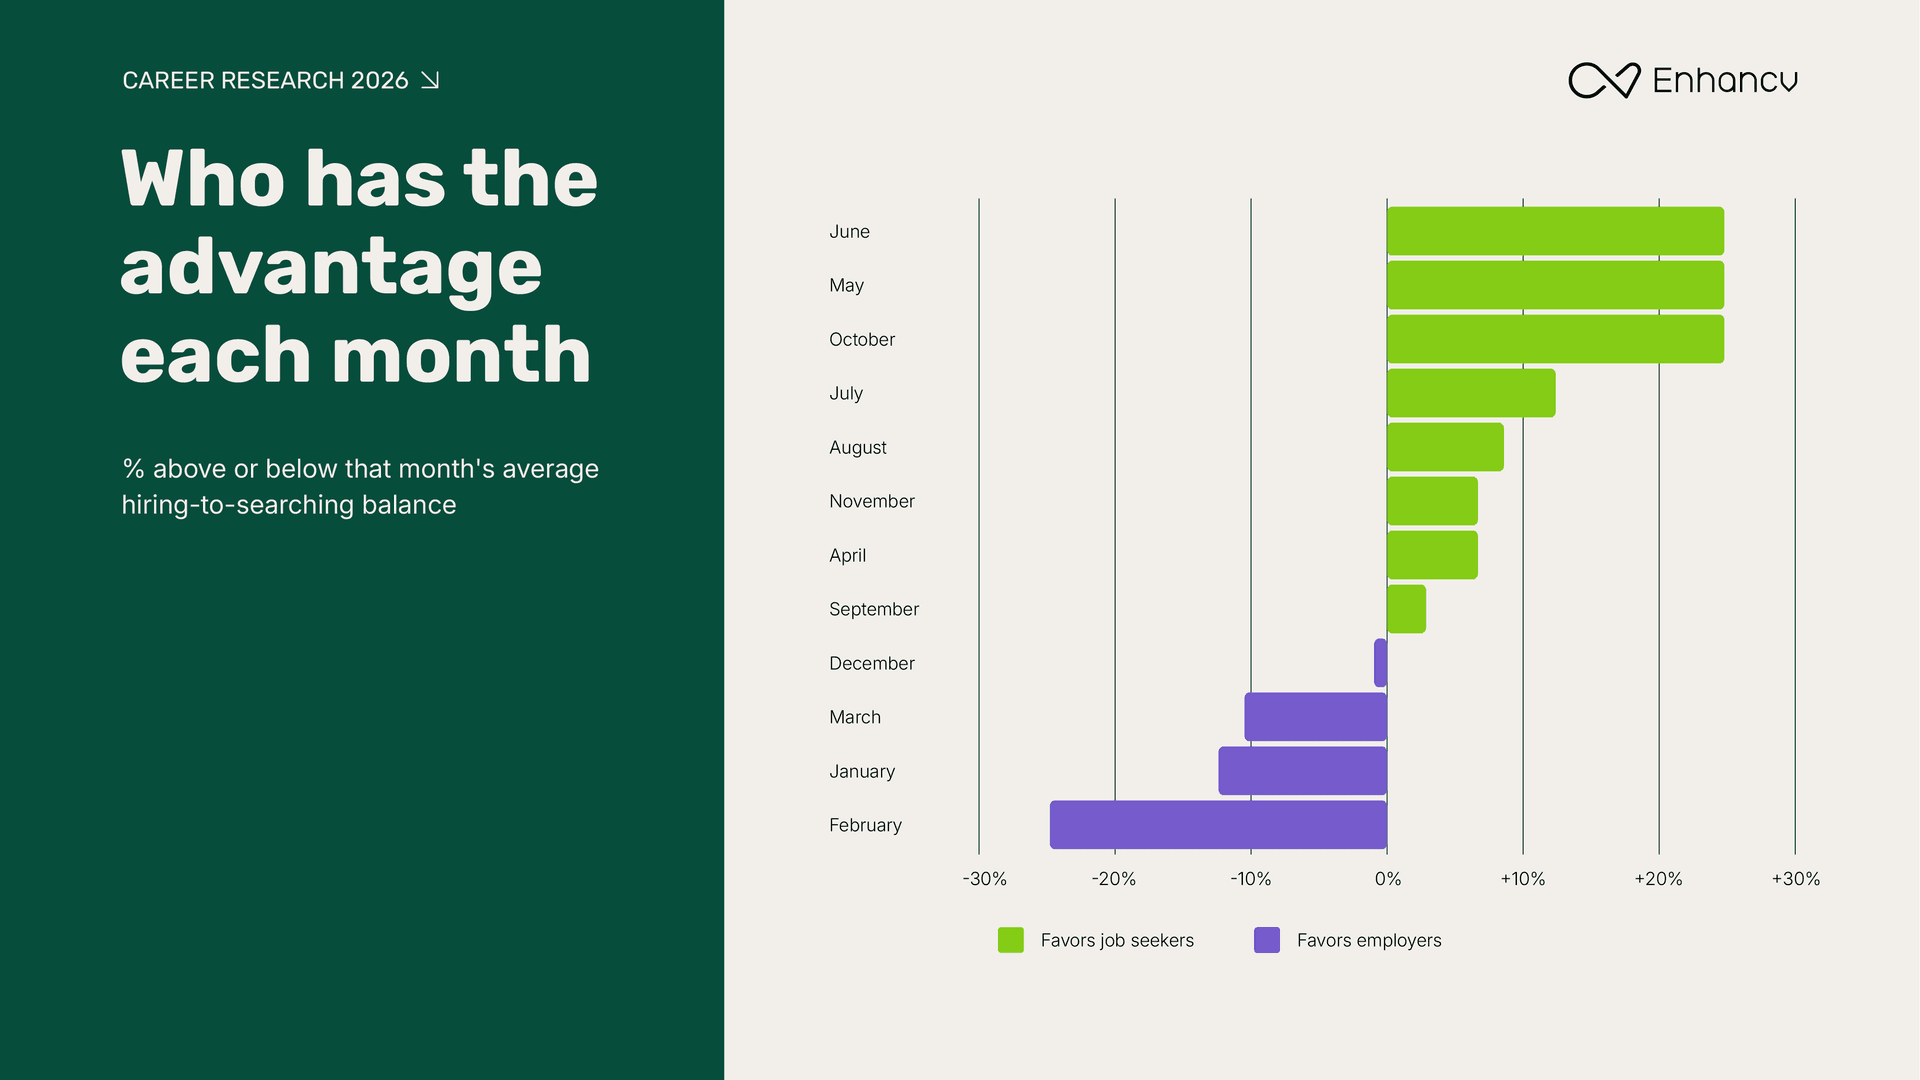
June, May, and October favor job seekers the most—the best odds of the year. February favors employers the most, by a wide margin: the most people competing against each other for the hiring that's realistically happening.
We also checked this month by month across each of the five years individually, not just the median, since a median can hide a pattern that only shows up in some years.
June, July, August, and October favored job seekers in all five years, no exceptions. May did in four of five. April, which shows up strongly in the postings data earlier in this piece, only favored job seekers in three of five years, genuinely mixed. January, February, and March favored employers in every single year, with no exceptions.
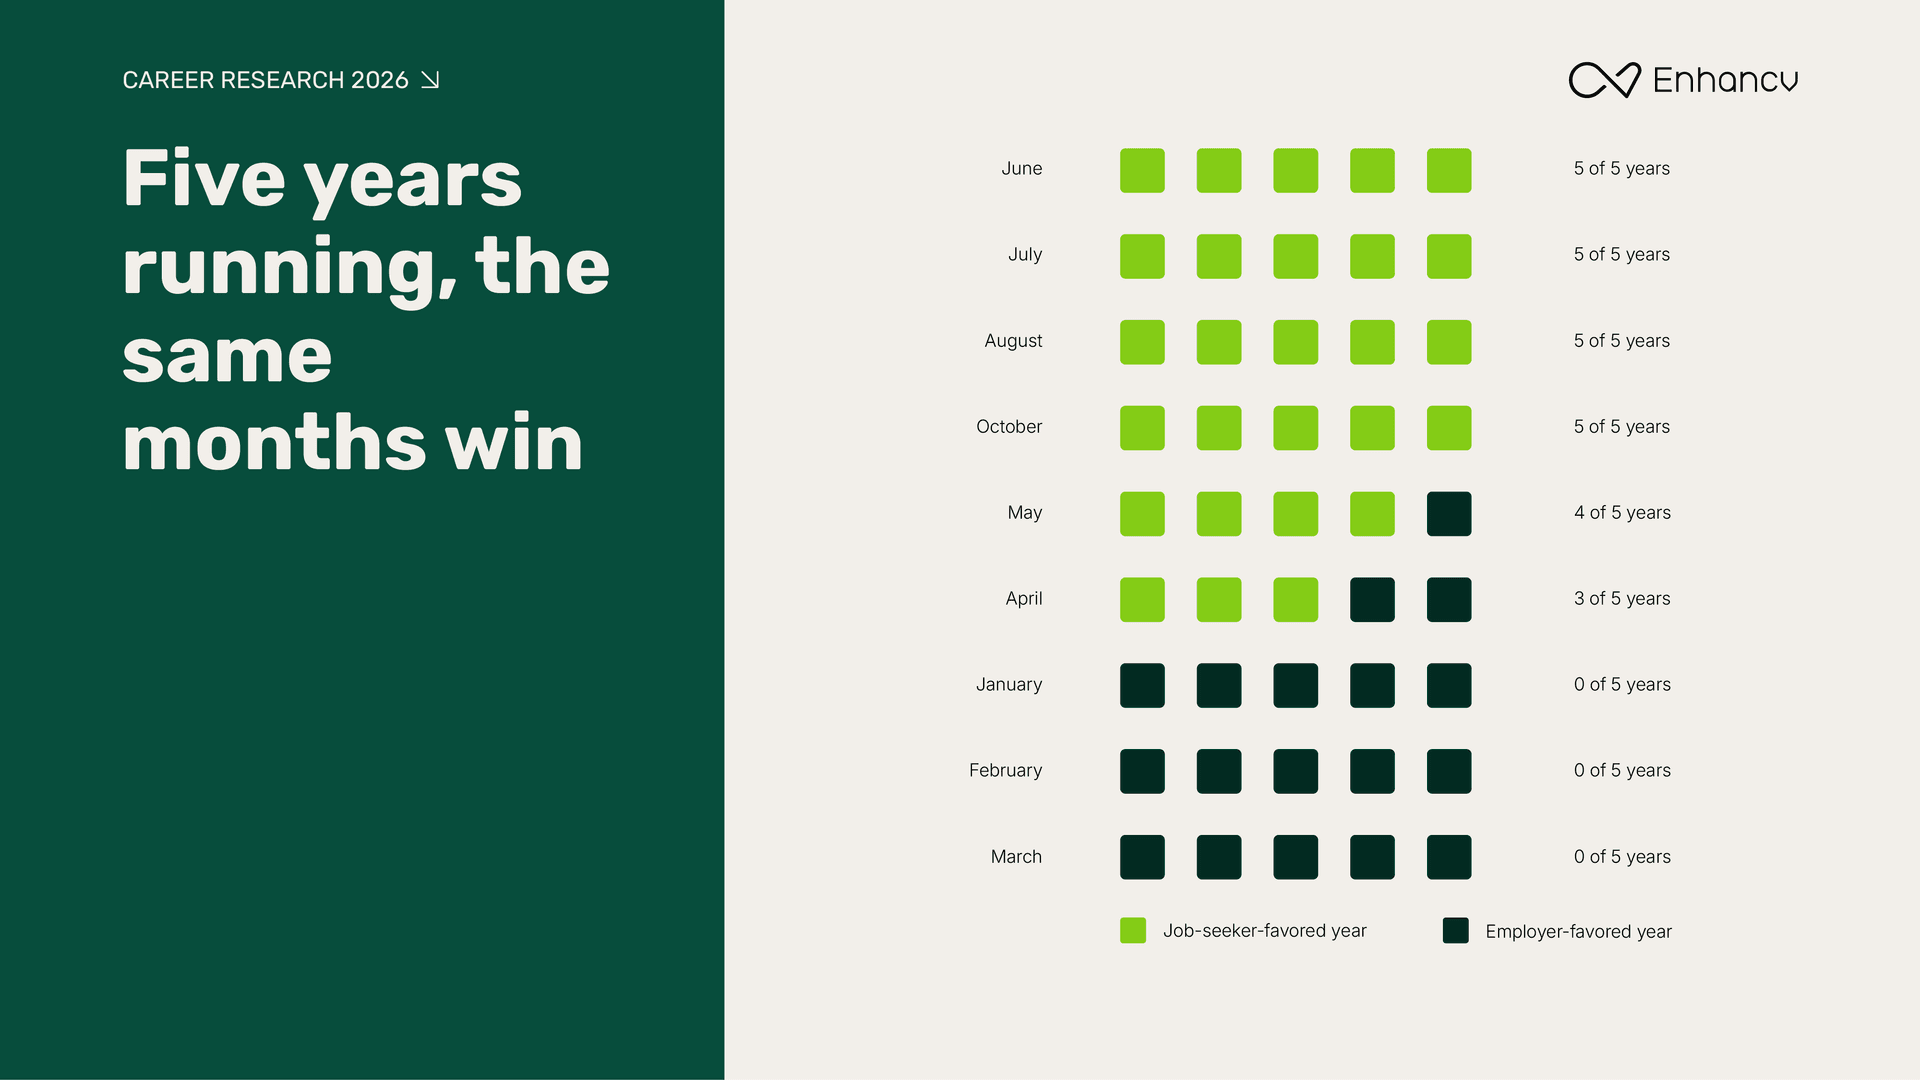
Among the four fully reliable months, June leads on one more count: it's also the single strongest month for actual hiring, 16.3% above average. More on why that combination matters most, later in this piece.
Why would the advice and the hiring calendar be this far apart?
We can't prove causation from this data, so we'll stay in the territory we can defend.
We asked the 500 recruiters we surveyed directly what slows hiring down at certain times of year. Budget approvals or fiscal-year timing and too few qualified applicants were named most often, at 38% and 37.2%—close enough on this sample to call it a tie. Holiday shutdowns (26.4%) and decision-makers being on vacation (20.2%) followed.
Part of the gap is ordinary. Hiring budgets and headcount approvals for a new fiscal year often aren't finalized until spring, which would explain why hiring builds through the year and peaks in May and June rather than January.
A second possibility looks more like a feedback loop.
Most career advice tells job seekers to apply in January and February. If enough people act on that advice, the applicant pool crowds into exactly those two months, regardless of whether employers are ready to hire.
That would make the advice partly self-fulfilling: telling people to apply in January could be part of why January is so crowded.
This part is still our own inference. The survey doesn't test it directly.
I think most people think New Year, New Me, or expect a Christmas bonus, and to hand their notice in after. It's just entering a market that's more saturated.
Jay Thandi, Director at Solis Recruitment
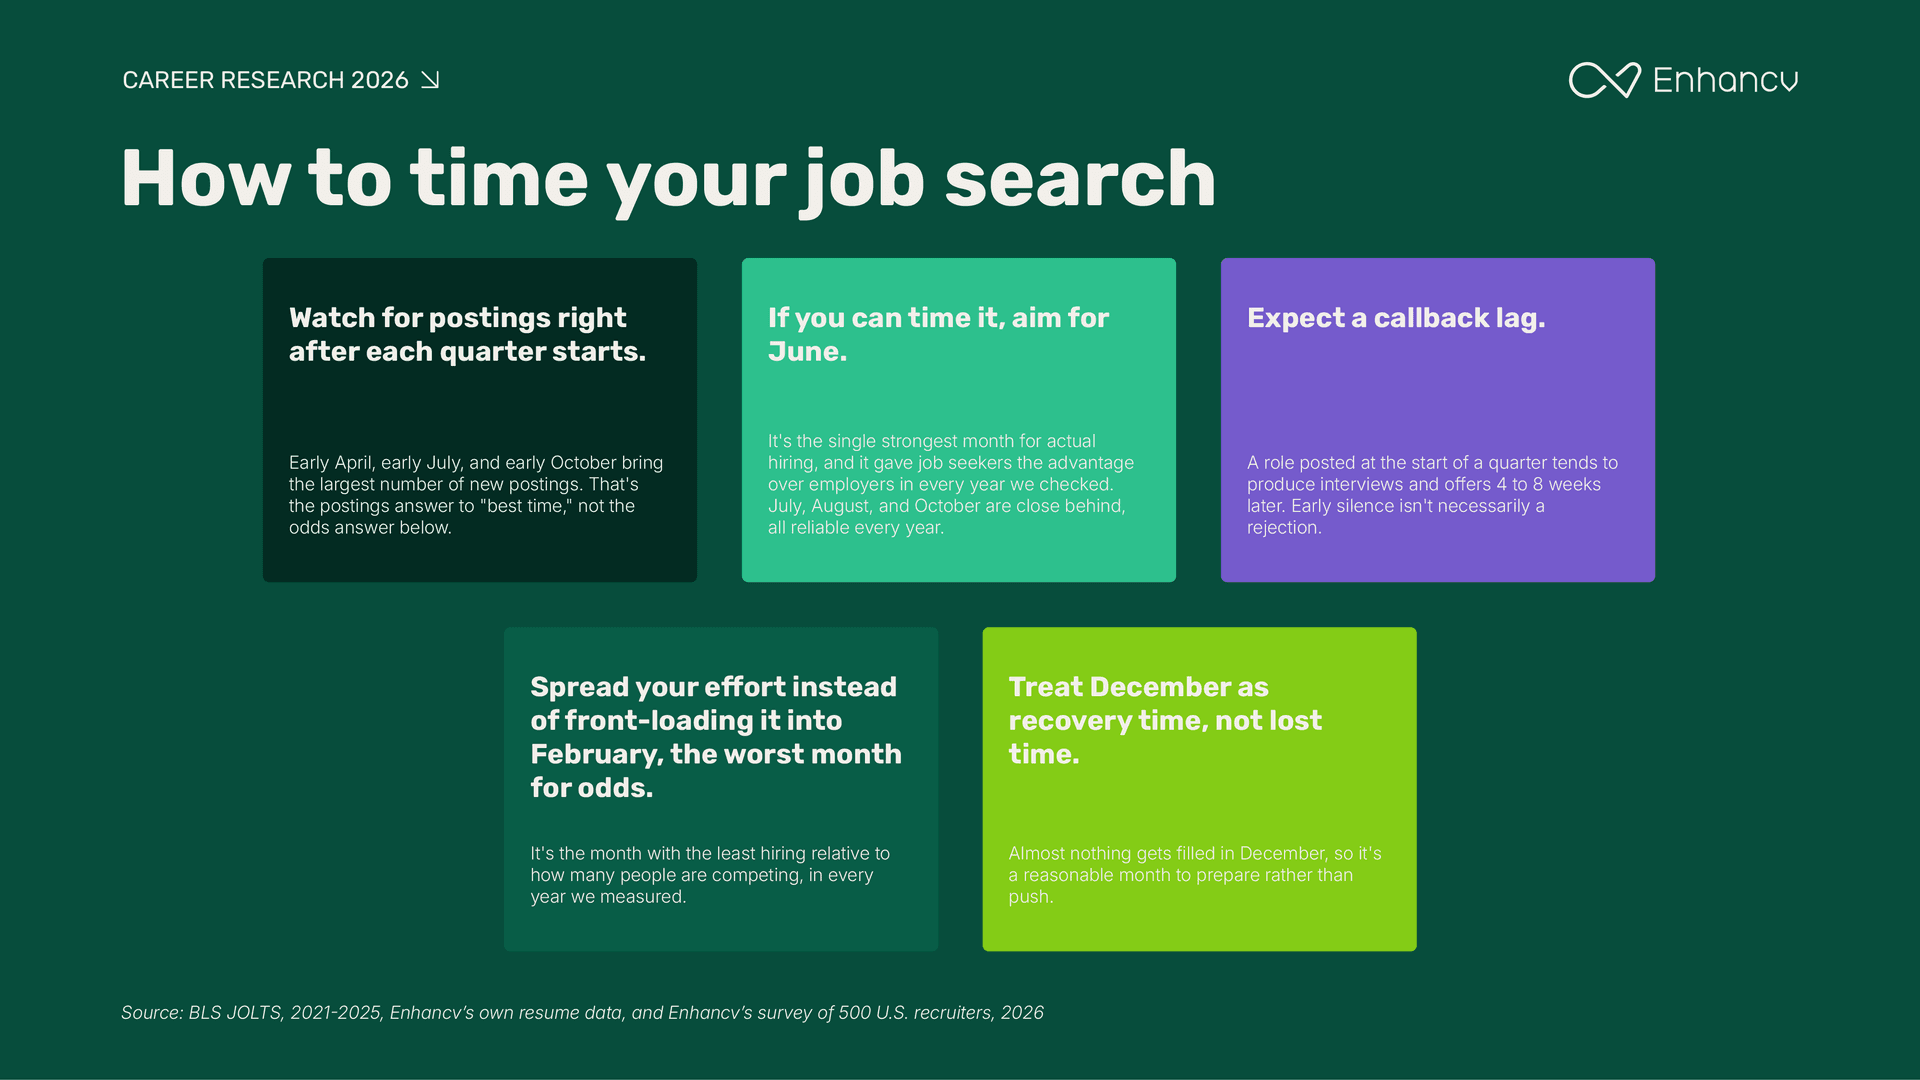
How should you time a job search?
Not by skipping January. Expect less from that specific window, and know where else to look instead.
I'd say it's a much better move for a candidate to reach out to recruiters about 3-6 months before they're ready to change roles and tell them, 'I'm not looking to move today, but I'd consider the right opportunity in the near future.'
Jon Hill
What people on the hiring side are seeing
Pieces of this survey already show up earlier in this article: budget timing behind the causation section, December agreement in the seasonality section, the spring posting push corroborating the openings data. Pulled together on its own, it works as a quick check: does what 500 recruiters say about their own year match what the government data says about the whole economy?
When’s the best time to apply for a new job?
Every popular answer to this question looks at one thing at a time: when the most jobs get posted, or when the most people say they're searching. Neither one alone tells you where the actual odds are best.
The real answer is where hiring is strong and competition is low at the same time. A month full of new postings doesn't help much if everyone else is applying to them too.
By that measure, January and February are the least favorable combination in the entire year. They're the two months with the most people competing against each other for the least hiring. Popular advice points job seekers straight at the two months working against them hardest.
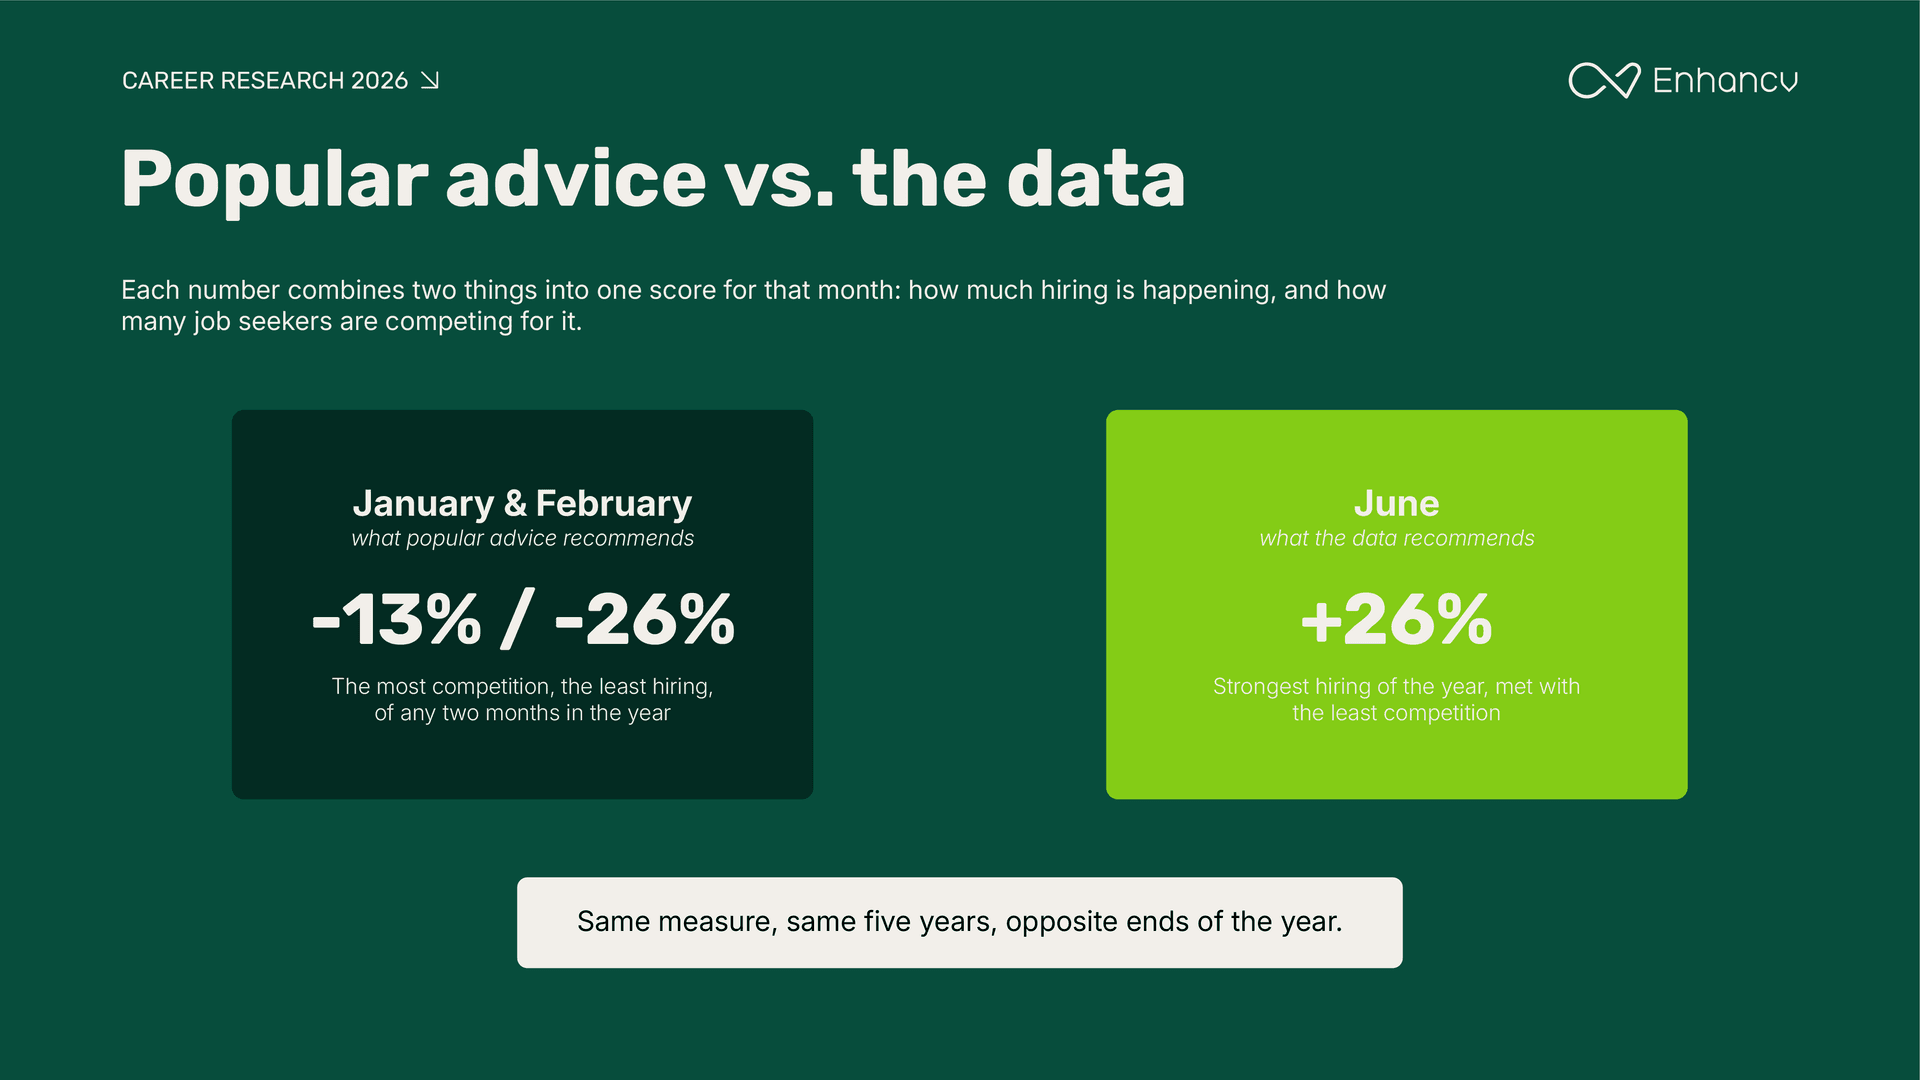
June is the opposite case. Hiring runs 16.3% above average, the strongest month of the year, while job-seeker activity has already cooled to 8% below average. It's the only month among the four most reliable ones, June, July, August, and October, that also leads on actual hiring volume. It held up in every one of the five years we checked, with no exceptions.
Methodology
Government data
All hiring and job-openings figures come from the U.S. Bureau of Labor Statistics' Job Openings and Labor Turnover Survey (JOLTS), not seasonally adjusted, pulled directly from FRED (Federal Reserve Bank of St. Louis). Two series are used: Job Openings, Total Nonfarm (JTUJOL) and Hires, Total Nonfarm (JTUHIL). Each series goes back to 2001.
Why five years, not the full history
This piece uses 2021 through 2025: 2020's pandemic swings distort any window that includes it, and Enhancv's own U.S. resume data only gets reliable in 2021. Every pattern here was also checked against the full JOLTS history back to 2001—the same shape holds, so that longer run confirms these five years rather than replacing them.
Every percentage stated in this piece is the five-year figure.
Detrending method
Every seasonal index in this piece uses the same calculation: each month is compared to a centered 12-month moving average around it, then the median of that ratio is taken across the years in question. A result of 100 means an average month. This method is applied identically to government data, Enhancv's own data, and the Google Trends export.
Hiring-vs-searching ratio
The job-seeker-advantage figure for each month is the hiring index divided by the resume-download index, both already expressed as a percentage of their own average month, where 100 equals average.
June's hiring index is 116.3 and its downloads index is 92.0: 116.3 ÷ 92.0 = 1.26, or +26%. A positive result means hiring outpaces that month's search activity, an advantage for job seekers. A negative result means search activity outpaces hiring, an advantage for employers.
Enhancv's own data
Figures on resume downloads and creation reflect 1.8 million U.S.-attributed resumes and 662,214 downloads, 2021 to 2025. Location is self-declared, taken from free text on the resume itself, not a verified address. About 18% of documents carry no location, and that missing group can't be assumed to behave like the group that did fill it in.
All of this measures candidate behavior only. It says nothing about who actually gets hired.
Recruiter survey
Enhancv's own survey of 500 U.S. recruiters and hiring managers, fielded through Pollfish across healthcare, retail, tech, manufacturing, and other industries, screened only by self-reported industry. Treat it as directional corroboration, not a representative sample.
Two questions (single busiest month, single slowest month) were only put to the 338 respondents who said their hiring has a peak or trough, rather than a steady pace with no real peak—percentages for those two questions are of that 338, not the full 500.
With 500 respondents, any single percentage in this survey carries a margin of error of roughly ±4 points at 95% confidence. Where two figures in this piece sit within a few points of each other, treat them as statistically comparable rather than a clear ranking.
External sources
Google Trends data (U.S. resume searches) was pulled and detrended the same way, matched to 2021–2025. Indeed Hiring Lab and Glassdoor are background only, on their own windows and methods, not primary evidence.
What this data doesn't show
Nothing here measures hiring outcomes: whether an application succeeds, or who gets hired. It measures job-seeker behavior and reported hiring and posting volume only. Outcomes would need a different study.
About Enhancv
Enhancv is a global AI Resume Builder with career tools that helps job seekers create modern, recruiter-approved resumes and cover letters. The company combines career data, user insights, and expert guidance to make job applications more effective and human.
Make one that's truly you.